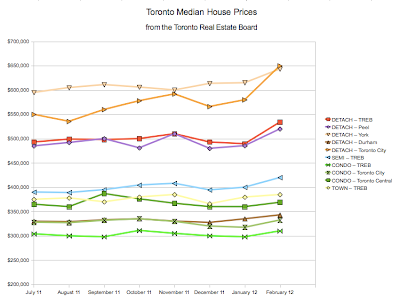
Despite medians historically being quite stable in the Toronto market, something jolted prices last month. Really jolted. It's like an entire spreadsheet column of outliers. I rechecked the number three times before posting.
 From TREB
Note that condo prices on the chart did not hit a new peak, despite the refilling of the giant sloshing punchbowl.
Guessing that this is a sales mix shift, I plotted the last few months of sales by price range and normalized it to 100%.
The bright red line is Feb. And indeed, something odd is going on. Rather than follow a normal distribution like the rest of the months, Feb is a perfectly straight line on the backside. If this were my raw data, I'd carefully go through and make sure there wasn't a chunk of missing data in the 500-600k category. I hope TREB rechecked their numbers three times.

Note that condo prices on the chart did not hit a new peak, despite the refilling of the giant sloshing punchbowl.
Guessing that this is a sales mix shift, I plotted the last few months of sales by price range and normalized it to 100%.
 |
| Detached House Sales Mix Toronto |
3 comments:
Yes, the HPI change is still getting worked out. This is medians though that I'm tracking. The calculation of that is always exactly the same. (Put the values in order. Take the middle one. Report it. Very straightforward.)
The second chart also should not have changed calculation, that's simply the number of sales in each price range, by actual sale price, nothing to do with the HPI.
Post a Comment