Thursday, June 28, 2012

What Markets are Above Fair Value? DB Report

A chart from Alan Ruskin at Deutsche Bank showing the countries that having housing markets that still have not adjusted to fair value by the usual measures of price to income and price to rent ratios.

For the text record the worst remaining un-busted housing markets are:
Belgium
Canada and Norway in a close tie for second
France Australia vying for fourth
NZ and Netherlands
UK
Spain
Finland (overvalued strictly on Price to rent)
Denmark
Italy (overvalued mostly on Price to income)

Of housing booms and busts
The problem for the likes of Spain, the UK, Denmark and NZ, is that even after the adjustment, these markets are still substantially overvalued at least by these widely used metrics. The Spanish data would tend to point to an adjustment in these ratios by a further 25% before fair value is reached – presumably mostly through house price adjustments. This is before any overshooting, related to constrained policy, is considered.

The only thing that could save the Spanish banks at this point given the extreme pain from the small correction so far is polar melt causing the gulf stream to shut off precipitating a mass migration. (How's that for a doomer angle on it?)

Hat tip: VREAA

Monday, June 25, 2012

Moody's worries Canada's tightening is too late

Moody's warns on mortgage debt
The federal government’s attempt to cool the housing market “may have come too late” to prevent a harsh landing for residential real estate, Moody’s Investors Service is warning.
Given that the numbers are roughly equivalent to the U.S. before the crash there, I'd say that's a safe call.
“The government’s moves may have come too late, owing to the buildup in consumer debt that has already occurred,” Moody’s said in a research note Monday. “Canadian consumers’ reliance on low interest rates to support high debt loads remains a risk.”
But, but, it's all about the monthly payment, right?
“Previous rule changes had some effect in countering the stimulus provided by historically low interest rates but failed to stop Canadian household leverage from increasing,” Moody’s analysts William Burn and Andriy Stepanyants said in the report.
“Low interest rates are actually creating a domestic imbalance in terms of excessive household debt,” Toronto-Dominion Bank chief economist Craig Alexander said. “Ultimately you’re going to have to ween households off the drug of low interest rates.”
Debt is a drug. Cheap debt is meth.

For all the whining in the mortgage industry about the proposed changes, you'd think the rules were getting tighter than normal, rather than still being set at a paltry emergency interest rates and minimum down payments. Goes to show how recency makes people forget history.

Sunday, June 24, 2012

China softening property restrictions in areas not horribly overvalued

The FT reports that the government is making some small changes to the blunt instrument restrictions they put on the property market. Some areas, they point out, are not as crazy overvalued, but are caught up in the restrictions. China moves to lift property market
Aware of the dangers, the central government has started to loosen its reins ever so slightly. It has encouraged banks to offer discounts on mortgages to first-time home buyers and has prodded developers to increase construction of cheaper homes.
"Prodded"? The central government has been commanding developers to build affordable housing, and the numbers on units they break ground on is questionable. There is no funding to build the units and developers accustomed to juicy margins have not been receptive to charity work.
In China, economists see a house prices-to-income ratio of about 7 as reasonable, as was historically the case in fast-developing Asian economies. The norm in rich countries is closer to 4. Ms Yao of Dragonomics says the good news is that the nationwide market is fast approaching the preferred level as housing prices edge down while wages climb. The price-to-income ratio for houses peaked at 8.1 in 2009, but fell to 7.4 last year and will decline further this year, according to the Shanghai E-House real estate research institute.
7 was the ratio before 100 million rural dwellers moved urban and another 240 million were expected to migrate. That means new housing needs to be for the median salary, not the top 2%.
The bad news is that the price-to-income ratios in China’s leading cities are still extremely high: 12.4 in Shanghai, 11.6 in Beijing and 15.6 in Shenzhen.
Restrictions on buying a second home have shrunk demand. Well, that certainly implies that the top few percent drove the market up buying in bulk and prices will not find a landing until the ratio is much lower. Maybe not the 2.75 to 3.5 in the Western world, but given the shift in population, lower than 7.

Friday, June 22, 2012

Vancouver market was in trouble before the rule changes

The rule changes (and Europe, for some odd reason, not China) have been getting the pre-emptive narrative blame for what is going to be a painful crash in the Canadian housing market.

But for the record, Vancouver's market has turned well into bearish mode already. Nails meet coffin.

VHB on Vancouvercondo.info via Vancouverpeak.com provides these running statistics.

For June 2012:
Sell-list so far 44.1%
Projected month-end sell-list 44.3%
MONTHS OF INVENTORY
Inventory as of June 21, 2012 19346
Current MoI at this sales pace 7.98

Anything over 6.5 months is contractive to pricing. Now solid buyer's market.

How serious is a sell-list ratio of 44%?
Here's the last ten years of Junes:
year sell list sell/list
2002 2689 3850 69.8%
2003 3525 4301 82.0%
2004 3501 5594 62.6%
2005 4333 4742 91.4%
2006 3951 5460 72.4%
2007 4244 5533 76.7%
2008 2425 6546 37.0%
2009 4259 5372 79.3%
2010 2972 5544 53.6%
2011 3262 5793 56.3%
Mean 3516 5274 66.7%
median 3513 5496.5 72.4%

The only worse year for an imbalance in supply and demand: 2008. This is not a balanced market, it is a teetering one  And the kicker: Inventory has been building all year and with the rule changes is poised to make 2008 look like a cake-walk.

Let's be careful out there, people.

Thanks to b5baxter for keeping the inventory graph updated.

Thursday, June 21, 2012

Australia's households vanish

If you use the U.S. experience as a model, households can easily compress down much farther. Two things are temporary: equity and household size. Debt is forever.

Vanishing Households Undercut Claim Of Australian Home Shortage
The Pacific nation had 7.8 million households, data released yesterday from the 2011 Census showed. That compared with estimates of 8.7 million as of June 2010, according to the latest figures used by the National Housing Supply Council, a group created by the government in May 2008 to monitor housing demand, supply and affordability. Australia’s population also grew by 300,000 less than previously estimated, to 21.5 million.
Australia faces a shortage of about 369,000 homes by 2016, under a medium household growth scenario, which assumes the nation will have 9.7 million households by that time, the council said in a report released last week. While home prices across Australia’s eight state capitals fell for a fifth consecutive quarter in the three months through March, the longest stretch of losses on record, the Council has maintained that the gap between supply and underlying demand has widened.


Water usage rates suggest Melbourne is awash with unlisted vacant properties
Soos says the homes his report found are not identified by REIV's rental vacancy rate and says the listing of these homes on the rental market would alleviate rental problems in the city. He says 5.9% of homes he looked at were vacant and says the bulk of these are speculative homes, which rely on capital gains rather than rental incomes.

New limits on CMHC backed mortgages July 9

I had a feeling given the watering down of new OSFI rules that Flaherty would be forced to take some other action to limit growth in mortgage debt. And he's smart enough to make the timeline short so as to not goose the market too much in anticipation of the punchbowl getting yanked. (As noted on other blog comments, will this juice listings more than sales? Possibly. Depends on where we are in the in the general perception of a bubble. We might be about to find out where we are.)

Max borrowing against the home 80% down from 85%
(I presume this is under a re-finance, not HELOC, which is covered under OSFI at 65%)
maximum gross debt service ratio to be 39%
maximum total debt service ratio 44%
CMHC cap of $1 million
Max CHMC insured amortization of 25 years

Annoying the articles like this one credit Flaherty for his rounds of tightening without pointing out he was the one to loosen them in the first place.

Financial Post coverage
The reduction to a 25-year from 30-year period is equivalent to about a 0.9 ppt mortgage rate increase (assuming a 3.3% 5-year fixed rate and a $290k mortgage after 20% down on an average-priced $363k home). Notably, the impact is bigger than the switch from 35- to 30-year mortgages, which at current mortgage rates, would be equivalent to about 0.6 ppts of tightening. It’s also important to keep in mind that the amortization change won’t impact affordability across the entire market, but rather those that would be taking a 30-year amortization—according to the Canadian Association of Accredited Mortgage Professionals, that made up 40% of mortgages for purchase during 2011/12 (up to May).
Just out of curiosity. Why didn't they take action before household debt levels reached crisis point (as defined by where the U.S. crashed). It's not like they couldn't have known. And it's not like they didn't have 5-6 years of warning.

Wednesday, June 20, 2012

New Housing Starts (Dwelling Commencements) in Australia Down 25%

New dwelling commencements are down 25% year on year and 13% quarter on quarter. More alarming for the renter class, new private sector residential is down 38% year on year and 22% quarter on quarter.


Chart from ABS

Tuesday, June 19, 2012

Will some housing areas be protected in a decline?

The short answer is yes. The long answer is: it depends on what you mean by "protected". In LA, California, there is an area called Manhattan Beach. It is a very desirable neighborhood. As a result, there is slightly more pent-up demand for houses there than in many other areas of LA. Declines in prices are seen as an opportunity to move in, therefore it attracts imported wealth from other parts of LA.

So, let's take a look at the two markets. Here is a random house in LA on zillow  The house value isn't important (apparently I clicked on a flipper special, i.e. the $ signs marking sales. Odds are I was going to). What we care about are the other two lines. LA as a whole peaks at 605k and troughs at say 365k. That's a 40% decline.

 
 Meanwhile on the second graph of Manhattan Beach. Peak to trough it went from 1.5 million to 1.1 million. That's only a 28% decline.


So, yes, desirable areas will do a bit better. For some measure of "better."

Friday, June 15, 2012

About that 15% Drop TD warned about

The TD prediction that prices will fall 15% (or more) has really made the rounds. It's like they found the right price decline point to get attention. Telling people it's overvalued by 35% is too scary to pass along in the media. Vancouver home prices to drop 15 per cent in two to three years: TD Bank
"Some observers might point to the recent data in Vancouver as evidence that housing activity is going through a long-awaited correction. But the jury remains out. As we've pointed out, despite the recent pull-back in sales, the market remains in balanced territory and underlying prices are continuing to expand," wrote TD economists Derek Burleton and Leslie Preston.
I don't know what an "underlying price" is. But I'm just tossing this up here as an example. Funny thing about housing declines. The general masses don't notice/acknowledge/believe in the decline for 12 to 18 months. That shift in mentality, once in place, really makes the correction take hold.

Let's look back at the U.S. correction. That was a burst bubble, right? Everyone agrees with that, I expect.


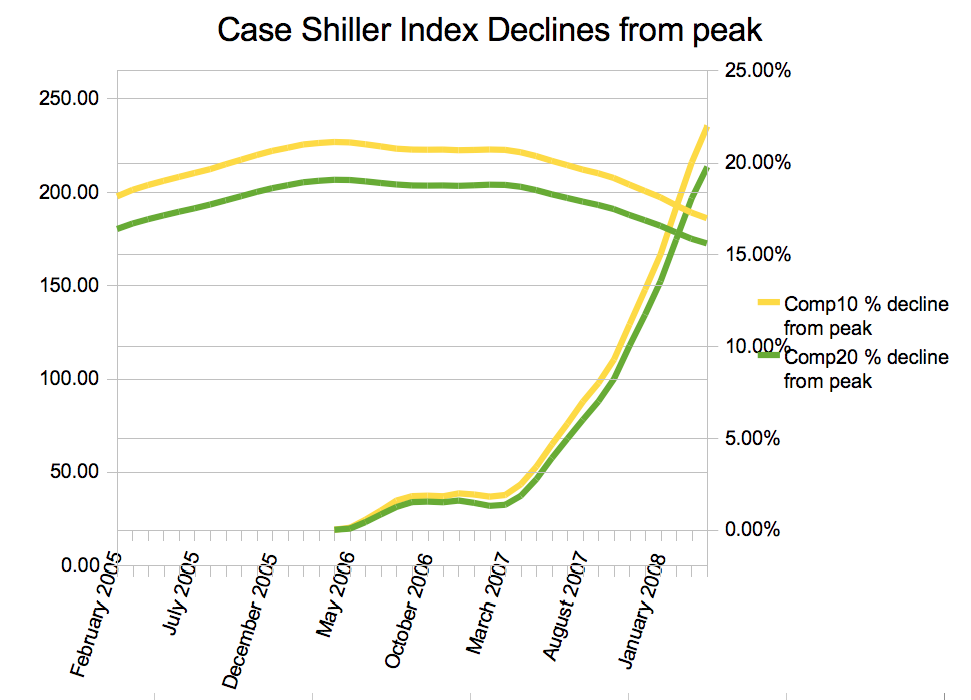
Case Shiller Peak to Current Prices
The graph above shows the peak index (April 2006) to present (plus a little before the peak). Bottom line shows percent decline from peak. Let's zoom in on the 2 years after the peak.

Case Shiller Peak to 2 years from peak  
The percent decline lines begin at the start of the bubble bursting. You might notice something interesting. The bursting bubble doesn't hit 5% decline until July 2007, a full 15 months after the bubble "burst". It didn't hit the dreaded 15% TD is warning about until January 2008, 21 months after the bubble "burst".

While I think it is disingenuous to claim one can't see bubbles before they burst (as if reversion to the mean isn't something that always happens with asset prices and one can certainly, especially in the modern age, pull of a long-term chart to see what the long-term mean is supposed to be, and without too much effort figure out what kind of correction is required to get there) I do agree that one can't tell that it was a burst until it happens, rather than a slow decline. The difference between the two is where the feedback loops come in (rising unemployment in the FIRE economy, buyer attitudes growing grimmer, possible credit crunches).

Sure, you can't say when and for certain that the decline will set in with a vengeance, but on the other hand if you were a new homeowner in the U.S. and it was February 2007 would you be feeling great about that non-existent bubble? If you were Kristin Annable, you probably would be feeling pretty good.
A Most people won’t be affected at all because they are living in their homes with no intention to sell, so they don’t care. It’ll alarm people, but unless you have to sell your house in the next six months it won’t matter. Also, it is self-correcting. People … who have been waiting five years to buy their first home and couldn’t afford to are now thinking, this is the time to jump in. Then that drives the prices back up.
Ah, I needed a good laugh. It's called the "bull trap". It even has a name. And, by the way, everyone in the U.S. who said this didn't think that after the fact. People hate being trapped. Being trapped in your own house, unable to take that better job across the country, not the greatest way to live.
Q This report says Toronto will not see a bubble, just a correction – what does that mean to you? A I hate the word bubble. Other than in retrospect, you won’t know there was a bubble until it already popped. Some people say that Vancouver was a bubble. But, what does that even mean? It has no definition, it is like diagnosing a disease with no treatment. Really all that matters is what happens in the next year.
If you hate the word bubble now, you are one sad camper. And who is this young lady? And I say young because she clearly wasn't around for the crash in 1990. "KRISTIN ANNABLE I am currently an intern at the National Post from Centennial College. I have an educational background in journalism, history and global studies." Eh, I was going to note this one, but it isn't even worth it.

Thursday, June 14, 2012

Pilot Lending Program in Wenzhou Falling Short

Worst of Chinese Slowdown Seen in Wenzhou as Stimulus Limited 
Jiang Xiangsong has 18 days to pay a 2 million yuan ($314,000) bank debt or his suitcase company in eastern China will go bankrupt. He's close to tears as he realizes his last hope, a government-backed office, won't help.
Wenzhou's more than 400,000 businesses make everything from shoes in dusty side streets to synthetic leather in dilapidated factories, much of it financed by unregulated lenders that spread during China's record 2009-10 credit boom. The decline of so-called shadow banking in the city, triggered by Wen's move to rein in a national property bubble, has left Wenzhou bearing the brunt of the country's economic slowdown.
I don't know about that particular cause and effect. The shadow lending bubble could have collapsed on its own. It is all mixed up with property, which was being liquidated to pay business debts.
"This is the worst year," he said as he waited for customers to buy sneakers from his half-empty shelves. "This place used to be packed with buyers from around the country, now it's full of unsold shoes."
On a recent morning, a single coach pulled out of Wenzhou's main long-haul bus station into an almost empty street. A few years ago, the road was a permanent traffic jam, clogged with buses and migrant workers arriving from other provinces, according to Liu, a taxi driver who like many people in China declined to give his full name.
All of this investment has been toward the goal of assimilating the Chinese peasant into the modern urban world. A reversal was not planned for.
Businesses are suffering because of weak demand, higher raw material costs and rising wages, as well as the breakdown in the system of unregulated money lenders who fund much of China's enterprise, said Zhou Dewen, head of the Wenzhou Small- and Medium-size Enterprise Association.

"Wenzhou's private lending system was built on trust, and now that trust is gone," said Zhou. He estimates there is about 1 trillion yuan of idle private capital in the city because "nobody is willing to lend to others."
Suitcase exporter Jiang, 45, said that before last year he would have had no problem raising the 2 million yuan he needs with a few phone calls to friends and fellow businessmen. Now, nobody answers the phone. Last week, Jiang's landlord refused to give him more time to make a payment on the 200,000 yuan rent for his factory because the landlord himself is short of cash after closing down his apparel business.

"Everyone around me is struggling," said Jiang, whose company's sales have dropped 60 percent this year.